| Prev | Next |
State Tables - Another View
A StateMachine can be visualized in a number of different ways. We have already looked at a diagram view of the StateMachine, but Enterprise Architect has a useful tool that allows the StateMachine to be visualized in a table. There are three variants of the table visualization:
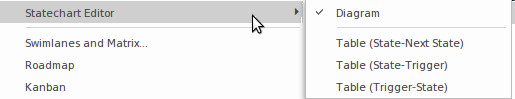
- State Next State View - where the States and Sub-States are organized as rows and columns and the cells represent the Transitions
- State Trigger View - where the triggers are organized as columns and the states as rows and the cells represent the Transitions
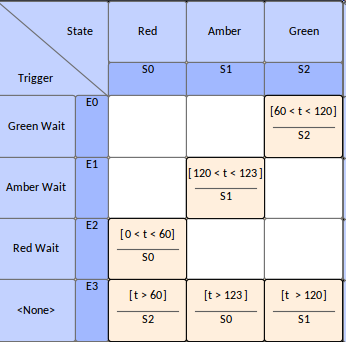
- Trigger State View - where the triggers are organized as rows and the triggers as columns and the cells represent the Transitions.
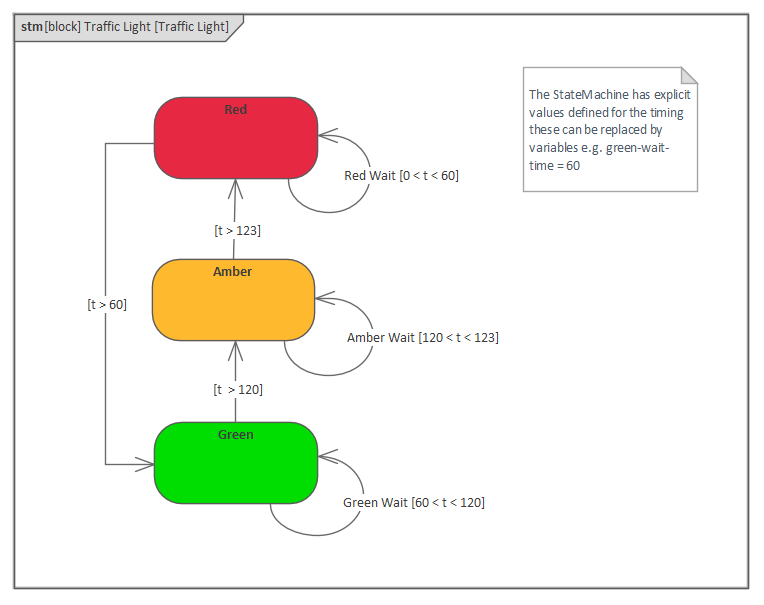
This diagram of the changes of a traffic light, like any StateMachine diagram, can be converted to a State Table.
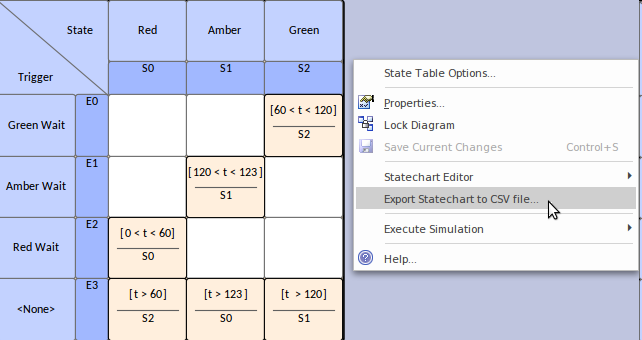
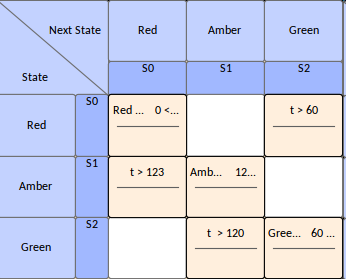
This view will be appealing and more natural to some audiences, and the engineer can simply toggle from one view to another. The States and their Sub-States are represented on both the rows and the columns of the table, and the transitions (representing the pathways between States) are represented in the cells.
The two other table views, as outlined previously, allow the States to be viewed against the Triggers that initiate them. These are helpful views when the engineer is more interested in the causal analysis and wants to view or analyze how events and triggers result in State behavior of the owning Block. This diagram shows the same Traffic Light machine represented as a table of triggers and States.
Enterprise Architect also allows these tables to be exported so that they can be analyzed using a spreadsheet. This is a useful mechanism, particularly when the StateMachine is complex and there are large numbers of transitions.