Please note : This help page is not for the latest version of Enterprise Architect. The latest help can be found here.
Profiling
During the lifetime of software applications, it is not uncommon to investigate application tasks that are determined to be performing slower than expected. You might also simply want to know what is going on when you 'press this button'! You can work this out quite quickly in Enterprise Architect by using its Profiler. Results can usually be produced in a few seconds and you will quickly be able to see the actions that are consuming the application and the functions involved. In the Execution Analyzer, Profiling is the process by which the stacks of threads are sampled at regular intervals over a period of time to produce a data collection. The data is then analyzed to produce a weighted call graph. Behaviors are usually identifiable as root nodes (entrypoints) in the graph, or branches near these points. When viewed the report can be stored as a file, in either a binary or an XML format. They can also be stored within the model as Artifact elements, and as Team Review posts.
This image is an excerpt of a program that was profiled from startup. Although there are four concurrent threads running (not shown here), it is plain from the report that, other than the startup task, one or all threads are involved in a single behavior CTrain::Execute.
Access Analyzer | Profiler
Capture
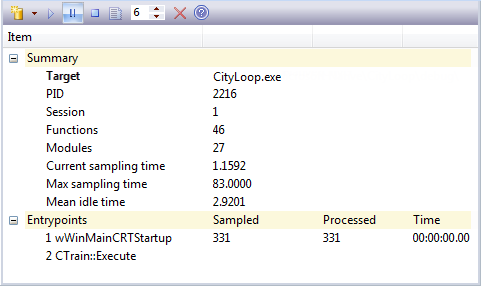
The Profiler is controlled using its toolbar buttons. Here you can attach the Profiler to an existing process (or JVM), or launch the process for the active Analyzer Script. The Profiler window displays the details of the target process as it is profiled. These details provide some feedback, letting you see the samples which are (or are not) being taken. You also have a number of toolbar options for pausing and resuming capture, clearing captured data, and generating reports. You can get access to the reporting feature by pausing the capture. The reporting feature is disabled whilst data capture is in progress.
Weighted Call Graph
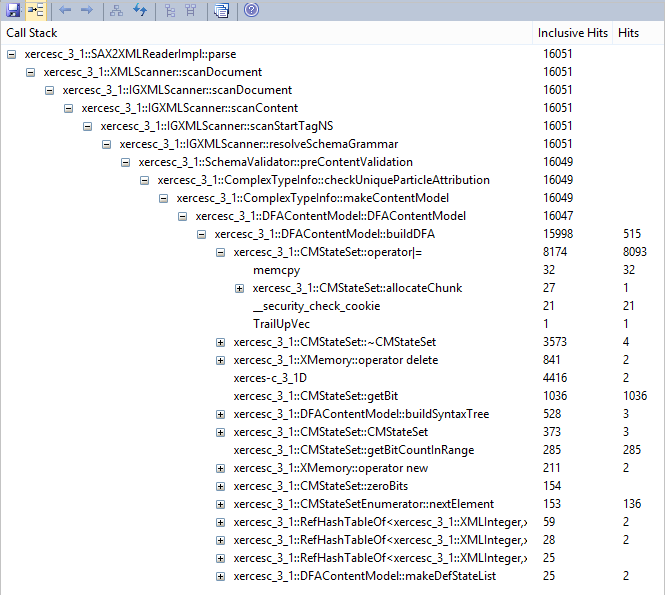
This detailed report shows the unique set of call stacks/behaviors as a weighted call graph.
The weight of each branch is depicted by a hit count. The weight of each branch is the total hits of that branch plus all branches from this point. By following the hit trail, a user can quickly identify the areas of code that occupied the program the most during the period captured. To understand the hit count consider this example of a profile where these three call stacks were detected.
A.B.C
A.B.D
A.B.D.E
The call stack A (implied) will have a hit count of 3
The call stack A.B (implied) will have a hit count of 3
The call stack A.B.D will have a hit count of 2
The call stack A.B.C will have a hit count of 1
The call stack A.B.D.E will have a hit count of 1
Function Summary Report
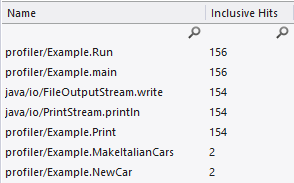
This summary report lists the functions and only those functions executed during the sample period. Functions are listed by total invocations, with a function presenting twice in separate call stacks appearing before a function that appears just the once.
Function Line Report
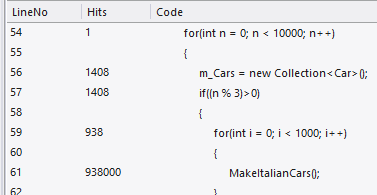
This detailed report shows the source code for a function line by line displaying beside it the total times each was executed. We uncovered code using this report, that exposed case statements in code that never appeared to be executed.
Support
The Profiler is supported for programs written in C, C++, Visual Basic, Java and the Microsoft .NET languages.
Notes
- The Profiler is available in Enterprise Architect Professional editions and above.
- The Profiler can also be used under WINE (Linux and Mac) for Profiling standard Windows applications deployed in a WINE environment
Learning Center topics
- Alt+F1 | Enterprise Architect | Execution Analysis | Profiling Native Code | Introducing the Profiler


