Please note : This help page is not for the latest version of Enterprise Architect. The latest help can be found here.
Setting Code Breakpoints
Normal Breakpoints are typically set on a line of source code. When the Debugger hits the indicated line during normal execution, the Debugger halts execution and displays the local variables, call stack, threads and other run-time information.
How To:
To set a breakpoint on a line of code, follow the steps below:
Step |
Action |
See also |
|---|---|---|
1 |
Open the source code to debug in the integrated source code editor; |
|
2 |
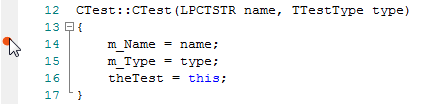
Find the appropriate code line and click in the left margin column. A solid red circle in the margin indicates that a breakpoint has been set at that position.
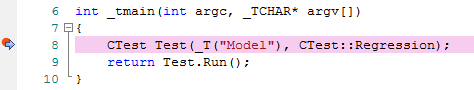
If the code is currently halted at a breakpoint, that point is indicated by a blue arrow next to the marker.
|
|
Learning Center topics:
- (Alt+F1) | Build and Debug | Debug | Add Breakpoint
The material ("material" includes all pages, documents and on-line graphics) on this web site is protected by copyright law. (C) 1998-2011 Sparx Systems Pty Ltd.