Please note : This help page is not for the latest version of Enterprise Architect. The latest help can be found here.
Define a Time Series Chart
Your model contains a great deal of information on both project design and project management, and a major benefit of the Chart feature is providing the facility to capture, summarize and present that information. Using the Time Series Chart you can record changes in multiple series of data over time. Each series corresponds to an SQL Query that you can either run manually or update automatically on a schedule run by the Cloud service. The value of each series is plotted on the line graph on the day or at the time it was collected.
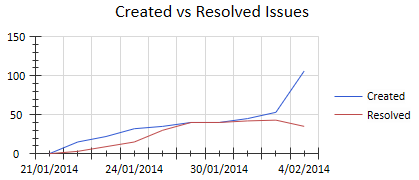
As an example, you might generate the Chart manually on different days, running two Queries showing Issues created and Issues resolved, for comparison. The Chart might resemble this:
After defining the content of the Time Series Chart, you can modify its appearance on the Appearance page of the element's Properties dialog.
Access Double-click on Chart element | Chart Details | Source
Define Content
Field/Button |
Action |
See also |
||||
|---|---|---|---|---|---|---|
Package |
To generate the Chart on the entire project, leave this field blank or click on the ( ... ) Browse button and select the <none> entry. Otherwise, click on the Browse button and select the specific Package to generate the Chart on.
|
|
||||
Include Child Packages |
If you have specified a Package, select this checkbox to extract information from the child Packages of that Package. Clear the checkbox to ignore any child Packages when extracting information from the parent Package.
|
|
||||
Data Point Interval |
Click on the down-arrow and select either:
|
|
||||
Exclude Weekends |
Enabled when the Data Point Interval field is set to Daily.
|
|
||||
Run On |
Enabled when the Data Point Interval field is set to Weekly or Monthly. If that field is set to:
|
|
||||
Series |
Lists the SQL Queries that will be run whenever the Chart is regenerated. This panel also shows the date on which the Query was last executed, and the number of records displayed as a result.
|
|
||||
Edit |
Click on an SQL Query name in the Series list and click on this button to edit the Query. The Edit Series dialog displays; see the Edit Series Dialog table below.
|
|
||||
Add |
Click on this button to add a new SQL Query to the Series list, to be executed when the Chart is regenerated. The Edit Series dialog displays; see the Edit Series Dialog table below.
|
|
||||
Remove |
Click on a SQL Query in the Series list and click on this button to delete the Query as a source of information for the Chart. A confirmation prompt displays. Click on the Yes button to delete the Query.
|
|
||||
Manual Record |
If you have set the Data Point Interval field to manual, click on this button to regenerate the Chart. The Results column in the Series list updates (if changes have occurred); the Chart itself does not change until you click on the OK button to close the dialog.
|
|
||||
OK |
Click on this button to scan the specified Packages, close the dialog and generate the Chart.
|
|
||||
Cancel |
Click on this button to abort the changes and close the dialog. The aborted changes include updates to the Results column if you have clicked on the Manual Record button.
|
|
Edit Series Dialog
Field/Button |
Action |
See also |
|---|---|---|
Examples |
(Optional) Click on the drop-down arrow and select an example SQL Query to use intact or to edit to suit your requirements.
|
|
Series Name |
Type a name for the SQL Query, to use as a reference to the Query in the Series list on the Source page.
|
|
Query |
Type the text of the SQL Query. |
|
Test Query |
(Optional) Click on this button to test the Query you have written or updated. A message displays to confirm that the Query was successful or to identify that problems exist.
|
|
OK |
Click on this button to save the Query, close the dialog and add or update the Query in the Series list on the Source page.
|
|
Cancel |
Click on this button to abort the changes, close the dialog and return to the Source page.
|
|
Learn more


