Please note : This help page is not for the latest version of Enterprise Architect. The latest help can be found here.
Generate, Save and Load Profile Reports
When you profile the execution of your MS Native Windows application, the Profiler generates a report in the Call Stack that shows how functions are called in relation to the profiled application; for example, how one function might be taking most of the overall time recorded, and what contributions are made by the subfunctions that function calls. You have a number of options for reviewing and sharing the resulting report. You might:
| • | View the report immediately, in detailed or summary form |
| • | File the report in binary or xmi format |
| • | Reload the report at a later time |
| • | Distribute the report as a Team Review resource |
| • | Attach the report as a document to an Artifact element |
Access Analyzer | Profiler (execute): View Report
Options
Action |
Detail |
See also |
||||
|---|---|---|---|---|---|---|
Display Report |
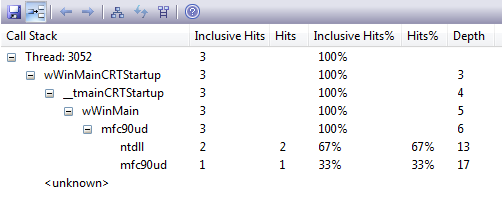
When you have run the Profiler, click on the Report icon in the Profiler toolbar. The generated report displays on the Call Tree Report tab of the Call Stack .
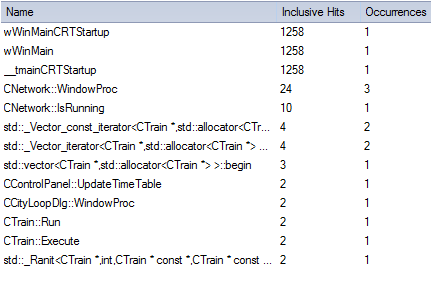
This report can be very detailed, especially if every level is expanded. You can display a summary of the report by clicking on the Summary Report tab of the Call Stack.
You can filter and reorganize the information in the report as for the results of a Model Search. |
|
||||
Save Report to File |
Either:
The Save As dialog displays. Browse to the appropriate file location and, in the File name field, type the file name. In the Save as type field, select the file type you want to use, either binary (.ssprf) or .xmi. Click on the Save button.
|
|
||||
Load a Saved Report |
Click on the Options icon The Open dialog displays, on which you browse for and select the report file. Click on the Open button; the Call Stack opens or refreshes with the loaded report.
|
|
||||
Generate a Sequence Diagram |
You can generate a Sequence diagram from any node in the Profiler report. To do this, either:
The generated Sequence diagram reflects all activity resulting from the selected node. It is created as a child diagram of the Interaction corresponding to the node, and immediately displayed in the Diagram View.
|
|
||||
Make Report a Team Review Resource |
You can save any current report as a resource for a Category, Topic or Post in the Team Review to share and review at any time, as it is saved with the model. The report can also be compared with future runs. To begin this process, select the menu option Team Review Context Menu | Share Resource | Add Active Profiler Report.
|
|
||||
Attach Report to an Artifact Element |
In the Project Browser, select the package or element under which to create the Artifact element. On the Call Stack window showing the report, right-click and select the Save Report to Artifact context menu option. You are prompted to provide a name for the report (and element); type this in and click on the OK button. The Artifact element is created in the Project Browser, underneath the selected package or element. If you add the Artifact to a diagram as a simple link, when you double-click on the element the Call Stack window displays, showing the saved report.
|
Notes
| • | If you add the Profiler report to an Artifact element and also attach a linked document, the Profiler report takes precedence and is displayed when you double-click on the element; you can display the linked document using the Edit Linked Document context menu option |
Learn more
Learning Center topics
| • | (Alt+F1) | Execution Analysis | Profiling Native Code | View Report |
| • | (Alt+F1) | Execution Analysis | Profiling Native Code | Load Report from Disk |


