| Prev | Next |
The PHP Debugger
The Enterprise Architect PHP Debugger enables you to debug PHP.exe scripts. This section discusses basic set up and the various debugging scenarios that are commonly encountered; the scenarios concern themselves with the mapping of file paths, which is critical to the success of a remote debugging session.
- Script Setup
- Local Windows Machine (Apache Server)
- Local Windows Machine (PHP.exe)
- Remote Linux Machine (Apache Server)
- Remote Linux Machine (PHP.exe)
Setup and Scenarios
Scenario |
Details |
See also |
|---|---|---|
|
Script Setup |
An Analyzer Script is a basic requirement for debugging in Enterprise Architect; you create a script using the toolbar of the Execution Analyzer. Select PHP.XDebug as the debugging platform; when you select this platform the property page displays these connection settings:
|
|
|
Local Machine Apache Server |
In this situation, consider this configuration:
In this scenario an Analyzer Script for the connection parameters might be configured as:
|
|
|
Local Machine PHP.EXE |
In this scenario an Analyzer Script for the connection parameters might be configured as shown, as file paths always map to same physical path:
|
|
|
Remote Linux Machine Apache Server |
In this situation consider this configuration: Local Machine:
Remote Machine:
In this scenario an Analyzer Script for the connection parameters might be configured as:
|
|
|
Remote Linux Machine PHP.exe |
In this situation consider this configuration:
In this scenario an Analyzer Script for the connection parameters might be configured as:
|
|
|
PHP Global variables |
When you are at a breakpoint, you can examine the values of PHP globals using the Analyzer Watches window. To list every global, type either 'globals' or 'superglobals' into the field. To show an individual item, enter its name. This image shows the value of the PHP environment variable $_SERVER being displayed. 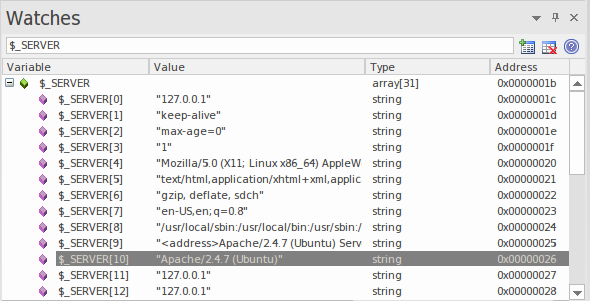
|