| Prev | Next |
Visualizing the Models
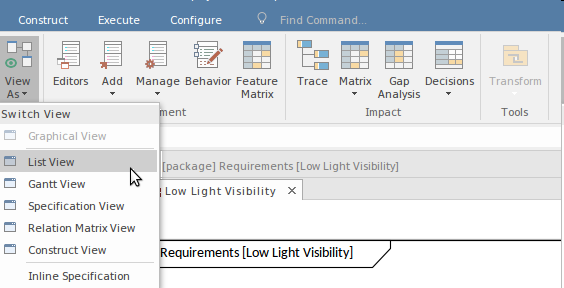
You might have been introduced to the SysML by reading introductory material in textbooks or in lecture notes as part of a tertiary qualification or in online pages. Much of this content presents the SysML as a language of diagrams, but Enterprise Architect expands the horizons of the language - and modeling in general - by providing a variety of ways to visualize information in the repository. The diagrams still play an important part, but in many circumstances there are more compelling ways to visualize or work with the repository content, including:
- Specification View - a spreadsheet or document view for those who are more familiar working this way
- List View - a table-based view similar to a spreadsheet where the properties of multiple elements can be viewed
- Traceability View - a hierarchical and graphical view where element relationships can be viewed to any level of nesting
- Gap Analysis Matrix - shows source and target elements and gaps in architectural models
- Relationship Matrix - a grid based view with two axes containing sets of elements
- State Table View - a view available for StateMachine diagrams to display the state transitions in a table
- Gantt Chart View - view a timeline when resources have been assigned
- Searches - view element lists that comply with a built-in or user defined set of criteria
- Publications - view elements in a publication using built-in or user defined templates
- Graphical View - view the elements as a diagram (this is the default view)
This diagram shows a Gantt Chart that has been automatically created from the resource information entered against elements that were visualized on a Kanban diagram. For more information see the Gantt View Help topic.
