| Prev | Next |
Chart Definition using Simulation
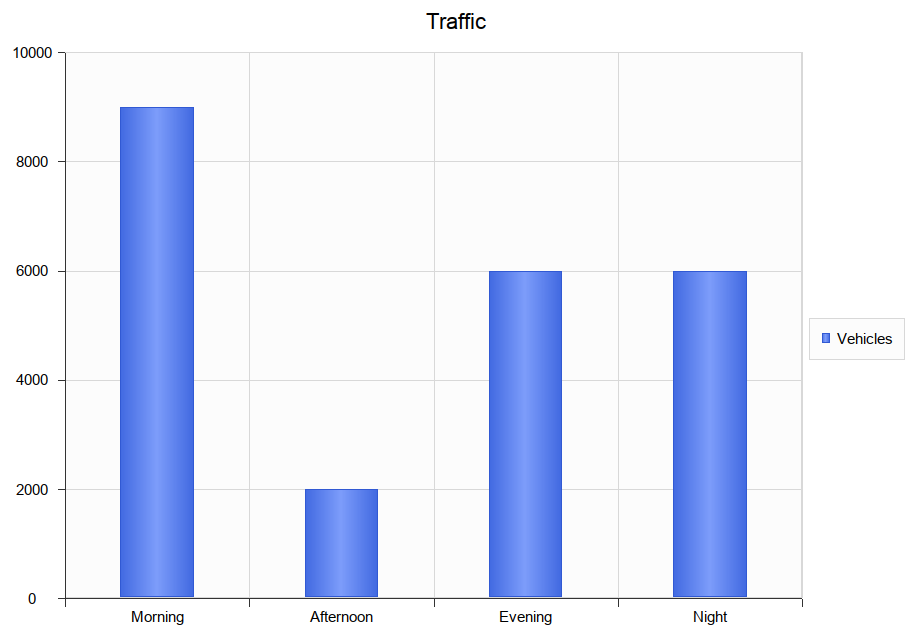
Simulations are a fantastic tool for observing behavior. At any point in the Simulation it is easy to tell where we are and the state we are in. As we step through a Simulation this information is typically discarded. In a Simulation that shows us, say, traffic numbers over a 24 hour period, we might easily observe the number of vehicles traveling through a tunnel during various hours in the morning and evening. It might be useful to retain this information after the Simulation completes, and to use it to provide something meaningful. The DynamicChart feature in Simulation allows us to do just that. Taking the example above, we could record the amount of traffic during each step of the Simulation and use it to produce a Chart that would clearly show how much traffic went through the tunnel during the 24 hour period of the Simulation. Charts can in effect display for us either a timeline of a Simulation or the sum effect of one.
Producing Custom Charts in Simulation
You can fashion all sorts of Charts from any Simulation. Each time a Simulation is run, any DynamicChart elements referenced (by name) by the Simulation are updated. The Simulation will search for any named Chart in the same Package as the model.
Follow this simple process:
- Create a DynamicChart element for the Simulation.
- In the initial step of the Simulation, use JavaScript to define a variable to hold the vehicle numbers.
//
// the traffic variable will hold the traffic numbers as Simulation proceeds and is initially zero
// each element of the array represents a period of the day, morning, afternoon, evening and night.
//
var traffic = [0,0,0,0]; - Next write the JavaScript that describes, in JSON format, the Chart to produce.
//
// The JSON instance describing the chart to produce. (complies with the EA DynamicChart Schema)
//
var chartData =
{
"Category" : "Column",
"Type" : "Simple",
"Title" : "Traffic",
"Series" :
[
{ "Label" : "Vehicles",
"Data" :
{
"Type" : "Column",
"Points" :
[
{ "Category": "Morning", "Y" : 0 }, // The Y values of the axis are initially zero
{ "Category": "Afternoon", "Y" : 0 }, // they will be filled in at end of Simulation
{ "Category": "Evening", "Y" : 0 },
{ "Category": "Night", "Y" : 0 }
]
}
}
]
}; - At various transitions in the Simulation update the traffic numbers.
//
// 2000 vehicles went through the tunnel in the afternoon (element 1)
//
traffic[1] += 2000; - At the end of the Simulation, use the data captured during the run to fill the series.
// fill points in series with the number of vehicles for each part of the day
var dataPoints = chartData.Series[0].Data.Points;
for(var dp = 0; dp < traffic.length; dp++)
{
dataPoints[dp].Y = traffic[dp];
} - Update the model.
// Call the EA function to populate the DynamicChart element named 'Vehicles' with this data.
sim.GenerateChart( "Vehicles", JSON.stringify(chartData));
Default Chart Produced by Simulation
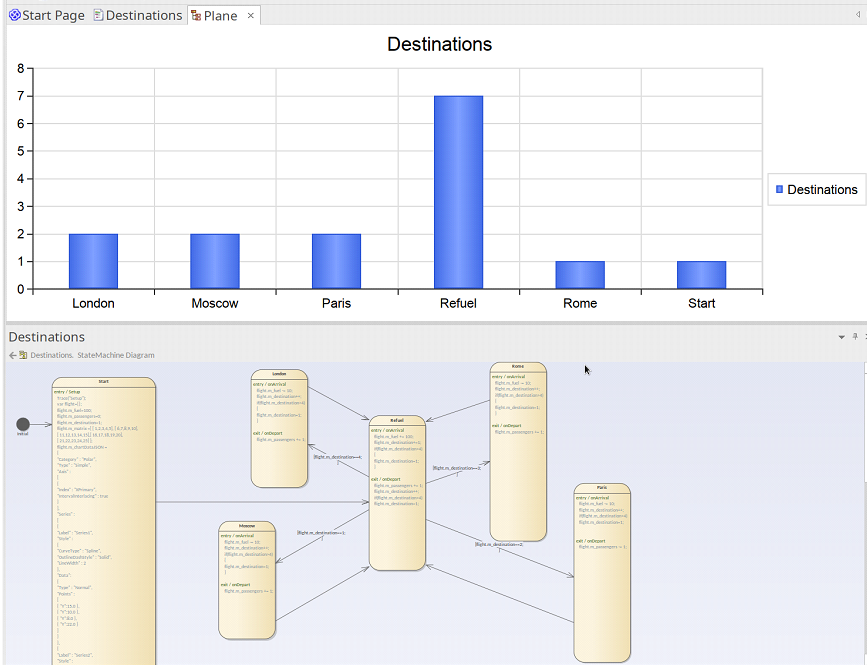
In addition to Charts you specifically produce, a summary Chart can be produced automatically by a simulation. All that is required is adding a DynamicChart Artifact to the Package and giving it the same name as the StateMachine. The default Chart summarizes the State transitions taken during execution of a simulation. If a default Chart is found when the simulation completes, that Chart's data is updated, and displayed automatically.
To add a default Chart to your StateMachine simulation follow these steps:
- Locate the Package containing the StateMachine on which to perform the simulation.
- Create a Dashboard diagram as a child of that Package.
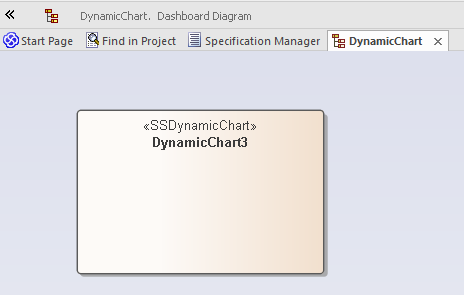
- Add a DynamicChart Artifact to the Dashboard diagram, and give it the same name as the StateMachine.
When the simulation ends, simply open the Dashboard diagram to reveal the summary.