| Prev | Next |
Chart Definition using JavaScript
In this topic we discuss coding a DynamicChart Artifact using just JavaScript and the Chart automation interface.
Define a Chart through JavaScript
The first thing you do is create a Dashboard diagram in the appropriate Package. Right-click on the Package and select the 'Add Diagram' option.
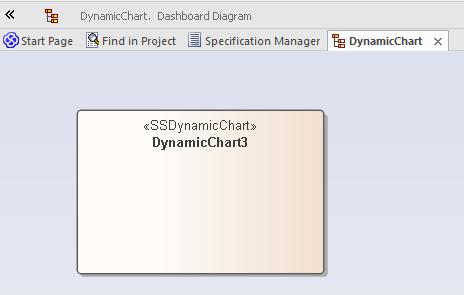
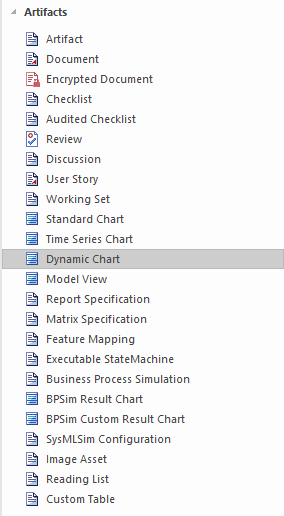
On the 'New Diagram' dialog select the type 'Construction > Diagrams and Charts' and, when the empty diagram displays, drag the 'Dynamic Chart' icon onto it from the 'Charts' page of the Toolbox.
Now you write the JavaScript to style and render the Chart, starting with the ConstructChart function that will be invoked automatically whenever the diagram containing the DynamicChart Artifact is opened for viewing. The GUID of the element is passed to ConstructChart as a parameter. Within this function, it is entirely up to you what type of Chart to display, the style of the Chart, the number of series it contains, and the data points that make up the series. Using the Chart Package from the Automation Interface, it is possible to display almost any Chart you require.
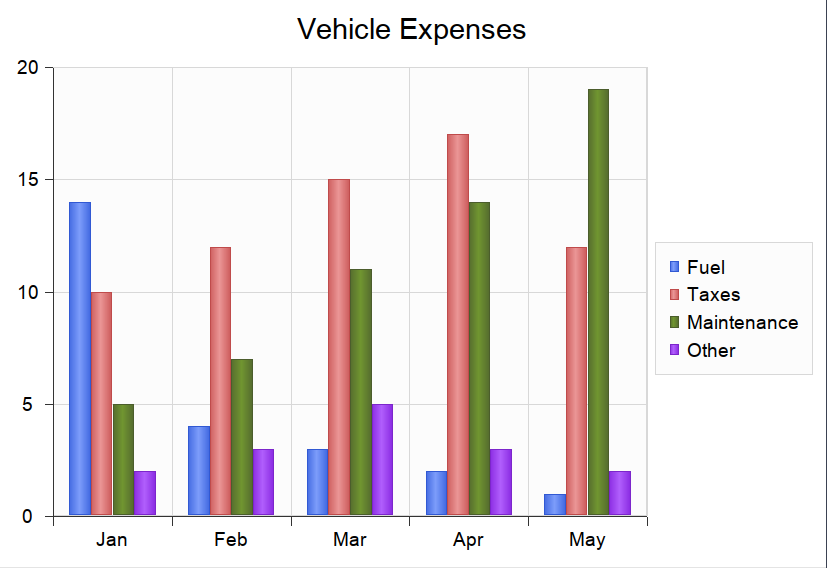
In this example you will create a Grouped Column Chart that shows vehicle expenses over a few months. Each group will represent a month and will be broken down into the different expenses incurred during that month.
To begin, click on the Artifact and press , or click on the 'Edit Chart Script' context menu option; each method displays the Code Editor window. The code to use is provided here, followed by the Chart it will produce when the diagram is opened.
Importantly, note:
- The !INC Local Scripts.ChartAutomation statement; all Chart scripts must include this statement
- The ConstructChart function (7th line in)
Code
!INC Local Scripts.ChartAutomation
var monthNames = [ "Jan", "Feb", "Mar", "Apr", "May", "Jun", "Jul", "Aug", "Sep", "Oct", "Nov", "Dec" ];
function Rand(min, max) {
min = cephes.ceil(min);
max = cephes.floor(max);
return cephes.floor(cephes.drand() * (max - min)) + min; }
function ConstructChart( guid )
{
var chart as EA.Chart; // The script first of all
var element = GetElementByGuid(guid); // declares the automation
var series1 as EA.ChartSeries; // objects it will use
var series2 as EA.ChartSeries;
var series3 as EA.ChartSeries;
var series4 as EA.ChartSeries;
chart = element.GetChart();
var chartCategory = ChartCategory.Column();
var chartType = ChartType.SIMPLE();
chart.SetChartType( chartCategory, chartType, false, true);
chart.Title = "Vehicle Expenses";
series1 = chart.CreateSeries("Fuel"); // The script then obtains the Chart object and creates the
series2 = chart.CreateSeries("Taxes"); // series. A chart is composed of a number of series, and
series3 = chart.CreateSeries("Maintenance"); // in this example each series will represent a type of expense.
series4 = chart.CreateSeries("Other");
series1.AddDataPoint3( monthNames[0], 14); // A series is composed of a number of datapoints and, here, the
series1.AddDataPoint3( monthNames[1], 4); // script adds the values for each of the points to each series.
series1.AddDataPoint3( monthNames[2], 3);
series1.AddDataPoint3( monthNames[3], 2);
series1.AddDataPoint3( monthNames[4], 1);
series2.AddDataPoint(10);
series2.AddDataPoint(12);
series2.AddDataPoint(15);
series2.AddDataPoint(17);
series2.AddDataPoint(12);
series3.AddDataPoint(5);
series3.AddDataPoint(7);
series3.AddDataPoint(11);
series3.AddDataPoint(14);
series3.AddDataPoint(19);
series4.AddDataPoint(2);
series4.AddDataPoint(3);
series4.AddDataPoint(5);
series4.AddDataPoint(3);
series4.AddDataPoint(2);
series1.SetGroupID(0);
series1.SetGroupID(0);
series3.SetGroupID(1);
series4.SetGroupID(1);
chart.Redraw();
}
Output
This is the Chart produced by the code.
Debugging a Dynamic Chart
After creating Dynamic Chart JavaScript, you can debug it as for any other code. Right-click on the Dynamic Chart in a diagram and select the 'Debug Chart Script' option. The script displays in the Debug View.
Further Examples
Further coding examples are provided in the Example Model (see the Package 'Reporting > Charts > Dynamic Charts'). Each Chart example provides a Dashboard diagram and a DynamicChart element. Select any of these elements and press to view the behavior code behind the Chart. Referring to these examples is the best way to understand how to code each type of Chart.
JavaScript is the primary language for coding Dynamic Charts using automation. However, it is certainly feasible for a third-party automation client to be involved in that process, the JavaScript host delegating tasks to the automation clients in languages such as C# and C++, which might be able to obtain data from outside the model in ways not available to scripts.