| Prev | Next |
Viewing Your Content
Enterprise Architect provides a range of ways to view the content that you and others have added to the repository, and many of these views also allow you to create content. Some views are suitable for the full range of technical and non-technical stakeholders from strategic levels down to engineering levels. The great thing about the views is that when you update information in one view, it is immediately reflected in all the other views.

List of alternative views available from the diagram Properties window.
Diagram View
Diagrams are the most expressive and ubiquitous of all the views in the tool and, when constructed well, will appeal to both technical and non-technical stakeholders. We looked at Enterprise Architect's diagram feature in the Adding Model Content Help topic, and you will know they can be used for both creating and viewing elements and connectors in the model. You can access various styles and presentation options, including whiteboard, hand-drawn, and custom style.
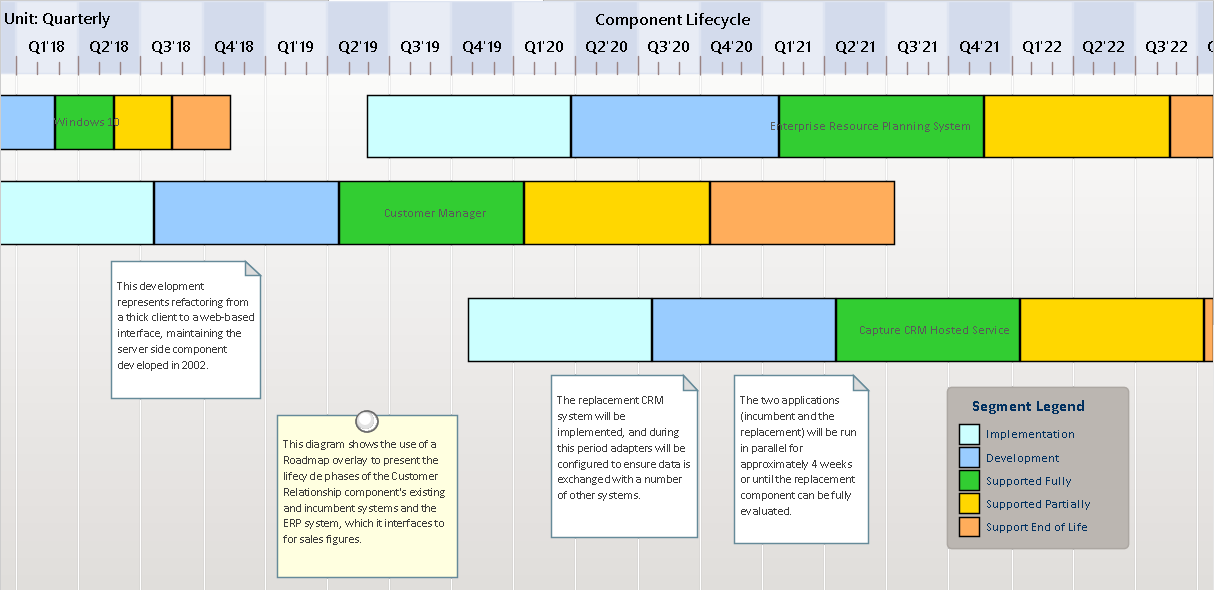
Roadmap diagram showing color used to visualize the status of the applications.
List View
You can use the List View to visualize the contents of a Package or a diagram as a list of elements. It is a useful alternative view to a diagram and allows element properties to be viewed and edited in a convenient spreadsheet-like view. Many analysts will prefer to view elements in a list, and when you make changes, these will be visible immediately in every other view of the element, including diagrams and the Browser window. There are also several options for filtering, sorting, and grouping elements in the list based on a range of system- and user-defined properties.

List view showing elements grouped by status and sub-grouped by type.
Matrix
The Relationship Matrix is a tool for visualizing the relationships between elements in a visually compelling view, resembling a matrix or spreadsheet. You can use the matrix to view the relationship between any two elements; for example - between Stakeholders and their Requirements, how Use Cases relate to Business Requirements or Functional Requirements, how Capabilities relate to Business Drivers, or which Components implement a set of requirements. The matrix has great appeal for non-technical stakeholders and can be included in documentation and viewed through WebEA, and even saved to a spreadsheet. You can also create relationships through the matrix and visualize which elements are loners and don't have any connections.
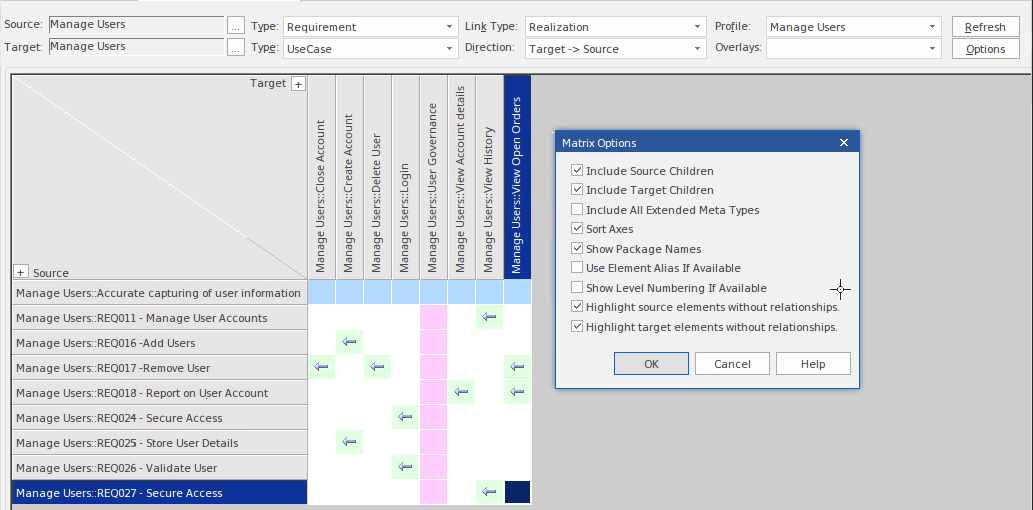
Relationship matrix showing 'lone' elements (no connections - green and pink squares) and options.
Specification Manager
We looked at the Specification Manager in the Adding Model Content Help topic, and you will know that it can be used for both creating and viewing elements in the model. It is particularly useful when a team member is not familiar with diagrams and is perhaps even a little intimidated by the modeling languages such as UML or ArchiMate and just wants to read things in plain English in a familiar word processor or spreadsheet view.

Specification Manager showing requirements and editable properties.
Traceability
The Traceability window will be your friend and help you keep track of how elements in your model are connected. It gives you a hierarchical view of element connections and allows you to query and visualize traceability as you traverse elements in the model, including using diagrams and the Browser window. Your colleagues might enter relationships to elements you have created, which will appear in the Traceability window when you select the element. The tool is particularly useful because a modeler will often choose to hide diagram relationships in particular circumstances, but by selecting an element in the diagram and viewing its connections in the Traceability window, all its relationships will be displayed.

Traceability window showing the hierarchy of elements and their connections.
Charts and Graphs
Using Dashboard diagrams, you can create high-quality charts and graphs that display repository information in a visually compelling way, such as the ratio of a Requirement Priority like Status in a Pie Chart, or the task allocation in a Time-Series Chart. There is a Toolbox page of pre-configured charts and graphs, but you are free to create and save any number of charts, sourcing data from anywhere in the repository. The charts and graphs provide valuable summary information that helps you manage all aspects of the repository, including properties like Status and Resource Allocation.
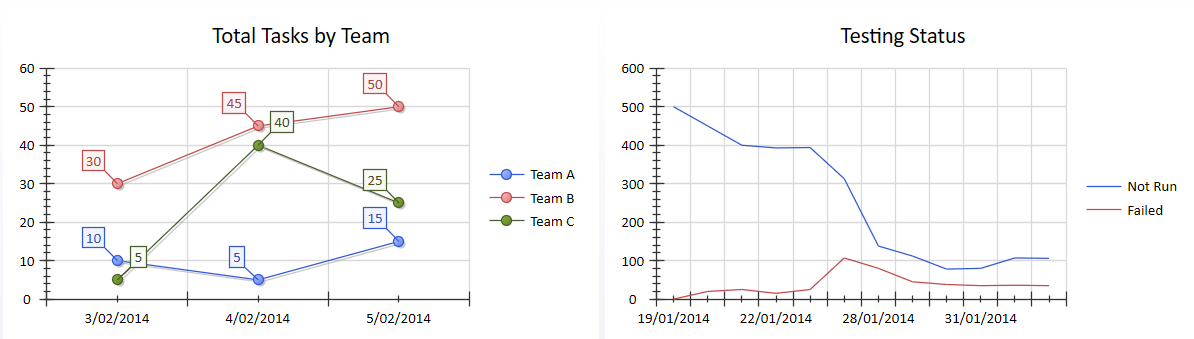
Charts showing team tasks and testing status.