| Prev | Next |
The Execute Window Selector
The Execute Window Selector provides immediate access to a range of windows for running simulations, working with source code, and analyzing and executing code. Each window name is a command that, when you click on it, opens that window.
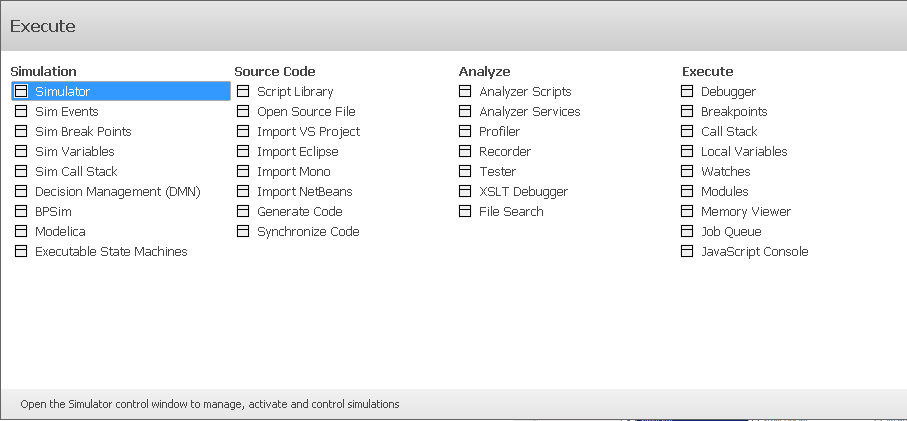
The windows are organized into four sets, as described in the tables of this topic.
Simulation
The 'Simulation' group of windows help you to perform, check and manage model simulations of the processing defined in sections of your model.
Options |
Description |
See also |
|---|---|---|
|
Simulator |
Displays the Simulation window, which provides the main interface for starting, stopping and stepping through your Simulation. |
Introducing Simulation |
|
Sim Events |
Displays the Simulation Events window, which is where you manage triggers and sets of events in a simulation. |
Simulation Events Window |
|
Sim Break Points |
Displays the 'Simulation Breakpoints' tab of the Breakpoints & Events window, which enables you to interrupt and inspect the Simulation process. |
Simulation Breakpoints |
|
Sim Variables |
Displays the Simulator Locals window, which shows all current simulation variables when the simulation is single stepping or paused at a breakpoint. |
View the Local Variables |
|
Sim Call Stack |
Displays the Call Stack window which, during a Simulation, displays information about the threads and current execution context of the Simulation. |
View the Call Stack |
|
Decision Management (DMN) |
Displays the DMN Simulation window. Using Decision Model and Notation (DMN) features you can not only model the decisions that your organization makes but also run simulations from these models to predict outcomes based on example data sets. |
Simulate DMN Model |
|
BPSim |
Displays the Configure BPSim window, through which you define a Business Process Simulation (BPSim) configuration to be represented and contained in a BPSim Artifact element. The configuration is created specifically for and from an existing Business Process, defined in BPMN. |
BPSim Configuration |
|
Modelica |
Displays the Configure SysML Simulation window, the interface through which you can provide run-time parameters for executing the simulation of a SysML model. |
Simulation |
|
Executable State Machines |
Opens the Find in Project view and performs an Executable StateMachines search, listing all Executable StateMachines in the model. |
Code Generation - StateMachines |
Source Code
The 'Source Code' group of windows help you to generate, import and synchronize code from sources both internal to the model and external.
Options |
Description |
See also |
|---|---|---|
|
Script Library |
Displays the Scripting window, which lists all available scripts in the model according to group. |
Scripting Window |
|
Open Source File |
Launches a 'File Open' dialog, through which you open a source file in a text editor within Enterprise Architect. |
|
|
Import VS Project |
When you have selected a parent Package in the Browser window, displays the Visual Studio Solution Import window through which you can import software projects authored in Visual Studio. |
Import Projects |
|
Import Eclipse |
When you have selected a parent Package in the Browser window, displays the Eclipse Project Import window through which you can import software projects authored in Eclipse. |
Import Projects |
|
Import Mono |
When you have selected a parent Package in the Browser window, displays the Visual Studio Solution Import window through which you can import software projects authored in Mono. |
Import Projects |
|
Import NetBeans |
When you have selected a parent Package in the Browser window, displays the NetBeans Project Import window through which you can import software projects authored in NetBeans. |
Import Projects |
|
Generate Code |
Displays the 'Generate Code' dialog, through which you can generate programming code from a UML element structure. |
Generate Source Code |
|
Synchronize Code |
Displays the 'Synchronize Package Contents' dialog, through which you can synchronize the model and source code, creating a model that represents the latest changes in the source code and vice versa. |
Update Package Contents |
Analyze
The 'Analyze' group of windows help you to analyze the performance of the applications you are developing, in whole or in part, in a number of ways.
Options |
Description |
See also |
|---|---|---|
|
Analyzer Scripts |
Displays the Execution Analyzer window, which enables you to manage all Analyzer scripts in the model. |
Managing Analyzer Scripts |
|
Analyzer Services |
Displays the Analyzer Services window, which lists the status of each Enterprise Architect service named in the config file, and its state. |
Analyzer Services Window |
|
Profiler |
Displays the Profiler window, which allows you investigate application tasks that are determined to be performing slower than expected; you can see the actions that are consuming the application and the functions involved. |
Profiling |
|
Recorder |
Displays the Record & Analyze window, which helps you to record the live execution of an application and to generate a Sequence diagram from those recordings. |
Recording |
|
Tester |
Displays the Testpoints window, through which you can develop a scheme by which constraints and rules governing the behavior of objects can be taken from the model and applied to one or more applications. |
Testpoints |
|
XSLT Debugger |
Displays the XSLT Debugger window and the System Output window at the 'XSLT Transformation' tab, to run a transformation, control the process and inspect the state of the transformation using Enterprise Architect's debugger in combination with breakpoints. |
Debug an XSL Transformation |
|
File Search |
Displays the Find in Files window, through which you can execute File Text Searches. |
Search in Files |
Execute
The 'Execute' group of windows help you to view the execution of code and manage various parameters such as the breakpoints, variables, DDLs and memory used in the execution.
Options |
Description |
See also |
|---|---|---|
|
Debugger |
Displays the Debug window from which a debugging session can be controlled and output from the debugging session can be examined. |
Debugging |
|
Breakpoints |
Opens the Breakpoints and Markers window, which allows you to enable, disable, delete and otherwise manage breakpoints and markers in your source code. |
Breakpoint and Marker Management |
|
Call Stack |
Opens the Call Stack window, which is used to display all currently running threads in a process. |
View the Call Stack |
|
Local Variables |
Opens the Locals window, which displays variables of the executing system. |
View the Local Variables |
|
Watches |
Opens the Watches window, which can be used to evaluate data items that are not available as Local Variables. This window is most useful for native code (C, C++, VB). |
View Variables in Other Scopes |
|
Modules |
Displays the Modules window, which for .NET and native Windows applications lists the DLLs loaded by the debugged process. |
Show Loaded Modules |
|
Memory Viewer |
Displays the Memory Viewer, which can display the raw values of memory in hex and ASCII. |
Inspect Process Memory |
|
Job Queue |
Opens the Job Queue window, which streamlines the process of working with Analyzer Scripts. |
The Job Queue Window |
|
JavaScript Console |
Opens the Console window, a command line interpreter through which you can quickly enable a script engine and enter commands to act on the script. |
Console Window |