Book a Demo

Please note : This help page is not for the latest version of Enterprise Architect. The latest help can be found here.

Prev Next

Tools Panel

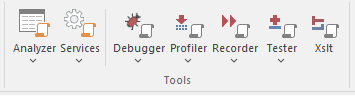
The 'Tools' panel brings together a collection of tools for analyzing the execution of an application. The tools available are a fully featured Debugger, an execution Profiler and a stack trace Recorder. There are also facilities for running the application and recording Test Point output, for subsequent analysis.

Available Facilities

Facility

Description

See also

Analyzer

Displays the Execution Analyzer window, which lists - by Package - all Analyzer Scripts defined in the model. From this window, you can create, edit and manage scripts that specify the commands and parameters required to build, test, run, debug, deploy and simulate your applications. The window's toolbar buttons provide for control of script tasks such as build, run, test and deploy, and also provide access to a range of debugging facilities.

The icon also provides access to the Job Queue window. This window streamlines the process of working with Analyzer Scripts; when an Analyzer Script context menu option is executed (for example, 'Build') it is placed in a job queue; multiple jobs can be queued, and other work performed while the jobs are processed.

Managing Analyzer Scripts The Job Queue Window

Services

These options enable you to start, stop and test local supporting VEA services. Those services might run a native Linux program, for example, or build a project.

  • View Status of all Services - displays a window that lists the status of each Enterprise Architect service named in the config file, and its state
  • Satellite Service
         -  Start
         -  Stop
         -  Test (Satellite service status)
  • Agent Service
         -  Start
         -  Stop
         -  Test (Agent service status)
  • Code Miner Service
         -  Start - reads the current service configuration and starts services that are configured to run
            and stops services that are not configured
         -  Stop All - stops any services that are currently running
        -  Edit Configuration File - prompts for the service config file to use, then opens it in an
            Enterprise Architect text editor
         -  Auto Start with EA - automatically starts services having the 'status:ON' attribute when
            the model opens
         -  Auto Stop on Close - automatically stops running services when Enterprise Architect is closed
Services

Debugger

Click on the drop-down arrow to display a list of options for starting and using the Debugger.

  • Open Debugger - open the Debug window; this window provides a toolbar for controlling Debugger operations such as run, step-into, step-over, pause and also displays debug output messages
  • Start Debugging - start the application, according to the debug options of the active analyzer script
  • Attach to Process - display a list of executing processes - select and attach to a process for debugging purposes
  • Create Stack Diagram - create an Interaction diagram based on the current execution stack; available only when execution is halted at a breakpoint
  • Create marker set for class - creates a set of breakpoint markers for methods of the selected Class
  • Switch to Profiler - switch dynamically from the Debugger to the Profiler, allowing performance monitoring and execution tracing
  • Set as JIT Debugger - set Enterprise Architect as the default Just In Time debugger; for Windows systems only
  • Set as JIT Model - set the current model as the default on which to perform Just In Time debugging; for Windows systems only
  • Process First Chance Exceptions - enable processing of First Chance Exceptions
  • Apply Debug Layout - apply a workspace layout containing windows useful for debugging, set out in a convenient arrangement
Process First Chance Exceptions Just-in-time Debugger Create Sequence Diagram of Call Stack Debug a Running Application Debugging

Profiler

The Profiler is used to record stack trace information for an application that is being analyzed, at pre-determined sampling intervals.

Click on the drop-down arrow to display a list of commands for starting and working with the application Profiler.

  • Open Profiler - open the Profiler window; this window provides a toolbar for controlling Profiler operations and displays a summary of the collected sample data
  • Attach to Process - display a list of executing processes - select and attach to a process to enable execution profiling and activity monitoring of that process
  • Start - reattach the Profiler to the last profiled application process (where available), otherwise start the application specified in the debug options of the active analyzer script and attach the Profiler to that application process
  • Resume - begin or resume collection of profiling data
  • Stop - detach the Profiler from the application process; the application process will continue to run - click on the Start button to re-attach to that process
  • Switch to Debugger - dynamically switch from Profiling to Debugging to allow finer grained inspection of application behavior
  • Create Report from Current Data - create a detailed execution call graph and overall summary, showing functions called and number of times a function was active when the Profiler inspected execution
  • Load Report from File - load a profiler report from a saved file
  • Save Report to File - save the collected profile data to a file
  • Stop Process on Exit - an option to stop the application process when the Profiler is detached from that process
  • Show Debug Output - optionally show debug output as the Profiler executes
  • Discard Fragments - discard partial stacktraces from samples
  • Discard Current Data - discard all collected sample data in preparation for a new run
  • Apply Profiler Layout - apply a workspace layout containing windows useful for application profiling, set out in a convenient arrangement
Call Graph Generate, Save and Load Profile Reports Profiling

Recorder

The Recorder is used to record information about function calls made by an application that is being analyzed.

Click on the drop-down arrow to display a list of commands for starting and working with the Recorder.

  • Open Recorder - open the Record & Analyze window; this window provides a toolbar for controlling Recorder operations such as run (the application), manual record, auto record, stop recording and also displays the recorded function call information
  • Attach to Process - attach the Recorder to an executing process
  • Start Recorder - start the application specified the debug options of the active analyzer script and attach the Recorder to that application process; recording will begin when execution hits a recording marker that has been set in the source code
  • Stop Recording - stop recording the execution trace of the application process; the application process will continue to run
  • Auto Record - automatically begin recording an execution trace, without manual intervention, once execution hits a recording marker that has been set in the source code
  • Manual Record - use the manual record functions to start and stop recording while stepping through source code in the Debugger
  • Step Thru - step through executing code while recording an execution trace
  • Save Recording to Model (Artifact) - save the recorded execution trace to a model artifact
  • Save Recording to File - save the recorded execution trace to a file in the local file system
  • Load Recording - load a recorded execution trace from a previously saved file
  • Clear Recording Data - discard any recorded execution trace in preparation for recording a new trace
  • Create Sequence Diagram - create a Sequence (Interaction) diagram from the current execution trace; requires that model and code are synchronized
  • Create Call Graph - create a Call Graph from the current execution trace; requires that model and code are synchronized
  • Create Class Diagram - create a Class diagram using the elements that are instantiated and accessed in the current recording
  • Create Test Point Diagram - create a Test Point diagram and Test Sets based on the elements and their active members that were hit during the recorded session
  • Synchronize Model to Source Code - synchronize the source code of the current application with the model, to ensure correct recording and creation of diagrams
  • Show/Hide Execution Point - show or hide the current execution point during the recording process; hiding this results in a faster recording time
  • Apply Recording Layout - apply a workspace layout optimized for use of the Recorder
Synchronization Generating Sequence Diagrams The Recording History

Tester

Test Points are a scheme by which rules and constraints governing the behavior of objects can be taken from the model to create Test Cases to verify the application.

Click on the drop-down arrow to display a list of options for working with Test Points and Test Cases.

  • Show Testpoint Window - open the Test Points window to manage, configure and run Test Points and associated Test Cases, Sets and Suites
  • Find Test Suites and Test Sets - search the current model for Test Suites, Test Sets and related elements used in managing Test Point based verification
  • Open Object Workbench - open a simple Object testing environment for Java and .Net; instantiate objects and dynamically call their methods
Object Workbench The Testpoints Window

XSLT

Opens the XSLT Debugger, to debug an XSL Transformation.

Debug an XSL Transformation