| Prev | Next |
Windows Panel
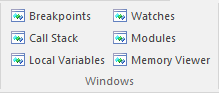
The 'Windows' panel provides access to a suite of windows associated with the debugging process, each of which provides information on an aspect of the application being debugged, particularly at a breakpoint.
Available Facilities
Facility |
Description |
See also |
|---|---|---|
|
Breakpoints |
Click on this icon to open the Breakpoints & Markers window, which you use to manage and configure source code breakpoints and other markers. |
Breakpoint and Marker Management |
|
Call Stack |
Click on this icon to open the Call Stack window, which displays all the currently-running threads in a process, at a breakpoint. |
View the Call Stack |
|
Local Variables |
Click on this icon to open the Locals window, which displays the local application variables at a breakpoint. |
View the Local Variables |
|
Watches |
Click on this icon to open the Watches window, which lists the customer variables by name when the application is at a breakpoint. |
View Variables in Other Scopes |
|
Modules |
Click on this icon to open the Modules window, which lists the modules an application has loaded and is using at run time. |
Show Loaded Modules |
|
Memory Viewer |
Click on this icon to open the Memory Viewer window to view a piece of memory when the application is paused at a breakpoint. |
Inspect Process Memory |